Share article
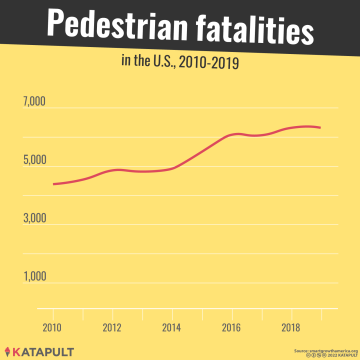
Smart Growth America (SGA), an organization that advocates for the improvement of streets and neighborhoods in the United States, recently published a report entitled, “Dangerous by Design 2021”, which includes detailed statistics regarding the deaths of pedestrians struck by vehicles. It not only identifies a rising trend in the total number of deaths, (2016-2019 having the highest on record), it also shows an incredible disparity in the risk of death present between different racial groups, socioeconomic strata and age ranges.

For example, researchers found that Black Americans are killed by drivers at an 82% higher rate than white Americans and that American Indian and Alaska Native people experience the highest death rates of any racial group (221% higher than white Americans). Possible factors responsible for the disparity could include the differences in the quality of roads and signage between neighborhoods that are predominately inhabited by one racial group, as well as differences in the sizes of preferred vehicles, the ratio of drivers to walkers, population density and a variety of other factors.
SGA also found an inverse relationship between wealth and rate of death; the richest neighborhoods had the lowest number of pedestrian deaths, and conversely, the poorest neighborhoods recorded the most. In fact, neighborhoods with an annual median household income of $2.5-41k had a rate almost three times as high as neighborhoods earning $90-250k. The authors of “Dangerous by Design 2021” identify the higher likelihood of having sidewalks and marked crosswalks in rich neighborhoods as a likely reason for the correlation, as well as the implementation of smarter street designs, made possible by a greater amount of financial resources.
Finally, and perhaps unsurprisingly, the elderly faired much worse than younger generations in death count statistics. Americans over the age of 75 have a pedestrian death rate about 66% higher than the national average and about 550% higher than 0-19-year-olds.

So, why is this a bigger problem in some areas than in others? Transportation agencies in certain states have blamed victims for being irresponsible rather than rethinking the concept of their own roads. Educational campaigns designed to change the behavior of pedestrians have, however, proven ineffective in reducing the number of fatal accidents in these states.
According to SGA, transportation agencies have a choice to make when designing any street, intersection or neighborhood. In order to make roads safer, visual cues must be given to drivers to increase their awareness of pedestrians and slow their overall speed, lessening the risk of fatal accidents. This can be done in a number of ways, including narrowing lanes and corners – wide lanes and corners allow for higher speeds and more mistakes – and adding curb ramps and high-visibility crosswalks paired with their own dedicated traffic signals. Shortening distances between intersections can also have a positive effect: Car speeds are reduced, and pedestrians are more likely to choose a designated crosswalk than to jaywalk when their path isn’t significantly lengthened by doing so.
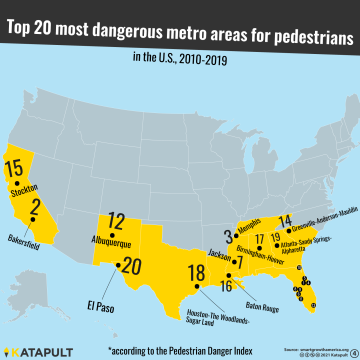
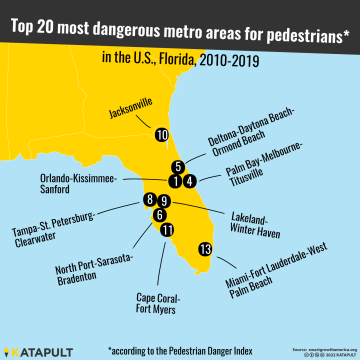
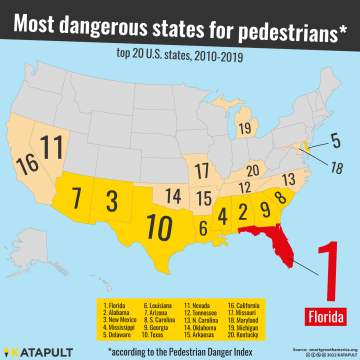
However, many state transportation agencies, particularly in the southern parts of the United States, often prioritize speed over safety when designing their roads. Where are you in the most danger as a pedestrian? The answer is Florida, by a landslide: Nine of the top 20 most dangerous cities in the U.S. can be found in the “Sunshine State”.

Authors
Geboren 1994 in den USA. Seit 2020 Redakteur bei KATAPULT. Zuvor Studium der Musik und Linguistik/Germanistik an der University of Alabama. Teamleiter von @katapultmaps.


